
Category: sourcing-agent
A supplier says a product is “trending.” A headline says China’s exports are surging. Neither tells you the question that matters before you place an order: are buyers in your target market importing this product, and is the trend strong enough to justify your inventory risk?
This guide shows importers how to check China export data by product, compare it with imports in the destination market, and spot the mistakes that turn a promising chart into an expensive buying decision. The method works across markets; examples below use Australia because its official trade data is accessible through the Australian Bureau of Statistics (ABS).
The mistake that can turn a headline into dead stock
National export growth is an aggregate. It combines products, destinations, prices and shipment volumes. A rise in China’s total exports does not prove that a particular product is gaining demand in Australia, Brazil or the UAE. Even a product-category increase may hide falling unit volumes or a shift toward higher-priced goods.
Before trusting a supplier’s “hot product” claim, ask: What exact goods are included in the number? Which market imported them? Did value rise because more units shipped, or because prices changed? Trade statistics can narrow the search, but they cannot forecast your sell-through or margin.
Step 1: Define the product before searching
Write down the product’s function, materials, components, specifications and intended use. Then identify a likely HS code and its level of detail. A broad product name such as “lighting” can cover goods with different functions and classifications; a broad code can group products that are not real substitutes for your item.
Use the code as a research key, not as a customs ruling. HS codes are harmonized internationally at the first six digits, while countries may add their own national digits. Product descriptions and national extensions can differ. If classification affects duty, permits or declarations, confirm it with a qualified customs broker or customs authority.
Step 2: Check China’s exports to your target market
Use China Customs monthly statistics to look for the product category and destination country. Check the available table before drawing conclusions: some tables report country-level totals, others report product groups, and some provide selected country-by-HS breakdowns. A table may not expose the exact combination of product, destination and month you need.
If the exact combination is unavailable, say so. You can use the closest defensible category as a directional signal, but do not label broader data as an exact product figure. The official China Customs monthly statistics includes tables for trade by country or region and selected exports by country and HS divisions. Availability and detail vary by table.
Step 3: Check imports in the destination market
China’s export data shows shipments leaving China; destination-country import data helps verify what the market records as arriving. Compare the same product definition and period where possible. Check the import partner’s country-attribution rule: Australia, for example, attributes import partner data by country of origin.
Australia example: where to find the data
The ABS International Trade in Goods release provides monthly trade tables and links to Data Explorer datasets, including merchandise imports by commodity, country and state. The Department of Foreign Affairs and Trade merchandise trade pivot tables provide additional monthly and historical views.
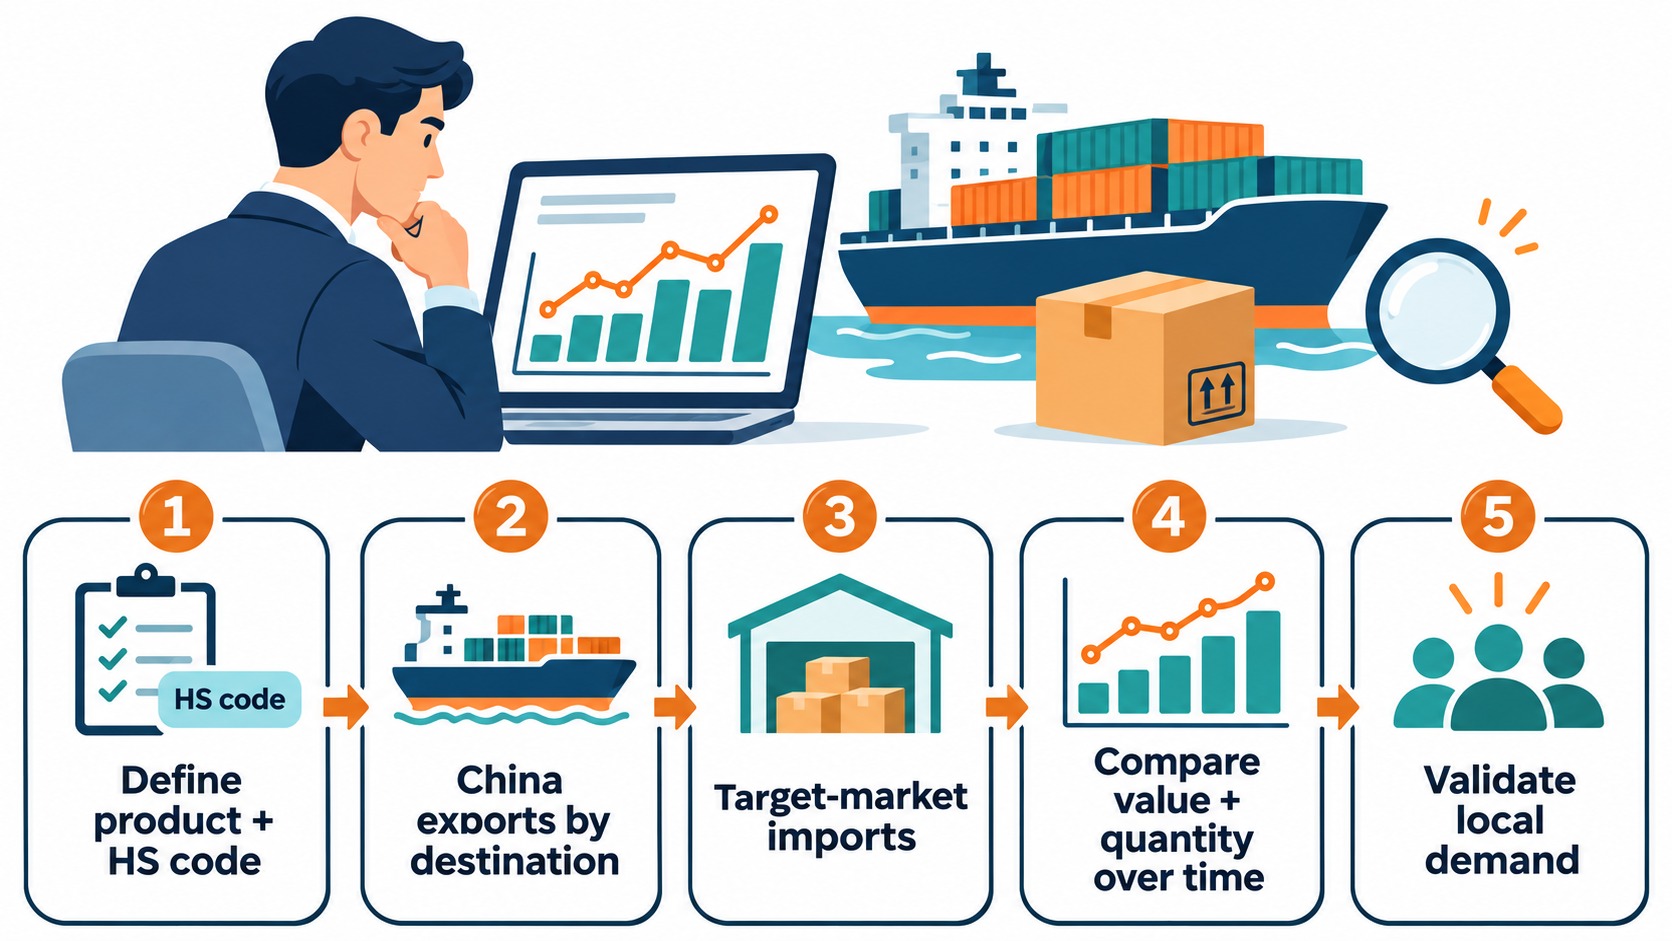
Buyer workflow: define the product, compare trade flows, then validate local demand.
Check the table’s classification before assuming it includes every dimension. ABS notes that detailed data can be affected by confidentiality restrictions. Some highly detailed commodity tables may not include partner-country information in the same file. When that happens, use the appropriate country-and-commodity dataset or state the limitation clearly.
Step 4: Compare value, quantity and time
One month is not a trend. Compare the latest available period with the same period a year earlier, then review a longer series or rolling 12-month view if available. This helps reveal seasonality and one-off shipment spikes.
Look at both trade value and quantity. If value rises while quantity is flat or falling, higher prices or a change in product mix may explain the increase. Also record the currency, valuation basis and whether the data is preliminary or revised. Do not compare series built on different statistical bases as if they were identical.
For a practical screen, use three questions:
-
Are imports of the comparable category increasing in the target market over multiple periods?
-
Is China a meaningful origin for those imports, and is its share changing?
-
Do both value and quantity support the same interpretation?
If one answer is unclear, treat the signal as incomplete and investigate further.
Step 5: Check whether trade activity matches buyer demand
Trade data records cross-border movement; it does not say whether consumers like the item or retailers can sell it profitably. It may include goods for manufacturing, business use, re-export or different product variants grouped under one code.
Cross-check the data against local retail listings, competitor assortments, price points, customer reviews, regulations and landed costs. For Australia, landed-cost calculations should account for freight, duties, taxes, testing or compliance costs that apply to the specific product. Speak with potential buyers and test samples or a limited assortment before committing to volume.
A rising import category can still be a poor opportunity if local shelves are saturated, the product misses local specifications, or the final cost leaves no room for margin. Conversely, a flat category total may conceal a viable niche. The goal is to test your product hypothesis, not to find a chart that guarantees success.
How MU Group can help turn research into a buying decision
MU Group provides integrated supply chain and procurement services, including market research, data analysis, product development, procurement management and quality control. Once a buyer has identified a category worth investigating, MU Group can help translate the market hypothesis into a product brief, compare product options and samples, coordinate supplier discussions, and assess the sourcing and quality steps needed before an order.
The buyer still needs to validate local demand, product compliance and the commercial case. Trade data is one input; supplier quotations, samples, specifications and landed costs determine whether the product is ready for a sourcing decision. Learn more about MU Group’s supply chain management services and procurement and supply chain services.
A pre-sourcing data checklist
Before approving a sample or purchase order, confirm:
-
The product description matches the HS category closely enough for your analysis.
-
You have checked China’s exports to the target market and the target market’s imports.
-
The country, period, currency and statistical basis are recorded.
-
You reviewed multiple periods and compared value with quantity where available.
-
Any missing country or product detail is clearly disclosed.
-
Local competition, buyer requirements, regulations and landed costs have been checked.
-
You are treating trade data as evidence to investigate, not a promise of sales.
FAQ
Can China’s overall export growth prove that a product will sell in my country?
No. Overall growth combines many products and destinations. Check product-level trade data and the target market’s import data, then validate local demand separately.
Why can China’s export data differ from my country’s import data?
Countries can use different reporting periods, classifications, valuation methods and partner-country rules. Australia, for example, attributes import partners by country of origin. Revisions and confidentiality rules can also affect detailed figures.
What if I cannot find data for the exact HS code and destination?
Do not substitute a broad category without disclosure. Use the closest comparable published category as a directional signal, explain the limitation and seek another official source or a customs-data professional if the decision depends on more detail.
Does a rise in import value mean more units are being bought?
Not necessarily. Prices, exchange rates and product mix can raise value even when quantities do not. Check quantity data where available and compare the same periods.
Is trade data enough to decide whether to place an order?
No. Combine it with local competition, buyer feedback, compliance requirements, supplier quotations, sample quality and landed-cost calculations.